

Have a specific service in mind or looking to share more about your project goals? Close out of this pop-up and fill out the form on the page; one of our sales specialists will get back to you ASAP.
Where are you spending your marketing dollars and how are they being tracked?
Here are some ways you are most likely spending your marketing budget. (and some tips in case you need more of it!)
Hopefully, in most paid campaigns you are running, you are sending traffic to your website, whether it’s a digital campaign or a different form of media. While this may not be the goal in every campaign, for example, running a native lead generation campaign in LinkedIn where people stay on LinkedIn to fill out a form, can be very a successful tactic, but for the sake of this post, we want to show you how you can use Google Analytics to determine how your marketing dollars are working for you, no matter what the goal of your campaign is.
So, how DO you determine how your marketing dollars are doing via Google Analytics?
Setting up Goals in Google Analytics is key to determining your conversion rate.
You can track anytime someone adds something to a cart, makes a purchase, fills out a form, and even calls your business.
To find and set up your Goals in Google Analytics, go to Conversions > Goals > Overview. For more in-depth information on setting up goals, see “Create, Edit, and Share Goals”.
Once you have your Goals set up, check them often to determine where conversions are happening, and where they are coming from. In Google Analytics your conversion rate is determined by calculating the number of conversions, divided by the number os sessions, times 100.
Here’s an example. If your goal is “contact forms completed”, every time someone fills out a contact form, it will count as a conversion. If you have 1,000 sessions and 20 conversions, the conversion rate is (20/1000) x 100 = 2%
Based on the conversion rates, you can determine which sources are converting the most leads and or sales, which campaigns may need some extra attention if they are not performing well, and which website pages may be driving the most conversions.
After you’ve reviewed your conversion rate, take a deeper dive into the sources of your conversions. Where are they coming from? Are they coming from channels you are spending money on, like Google Ads, or Facebook? Are they coming in organically because you’ve invested in a solid SEO or content strategy? Look at opportunities for improvement here. Are the sources performing as you expected? Better? Worse?
By linking up your Google Analytics to your Search Console, you can view all search terms that people are using to find your website.
Are more people searching your business by name than they were before? Seeing this specific search volume go up can help you determine that your marketing dollars are making an impact on your brand. Maybe someone saw an ad, an Instagram post, or even an advertisement on a poster or magazine page. Maybe they didn’t click on the link, or use the campaign URL, but remembered your name to search for at a later time.
When we are looking at keyword rankings, we will usually omit a company’s name, because we want to monitor what service or product-related keywords a business is being found for. However, when you are monitoring the success of a campaign or marketing spend, taking a look at branded searches and provide some valuable insights.
You can assign a value per lead within Google Analytics. How much is a lead worth to your business? When you assign a value to a conversion, you are able to see if your conversions are remaining profitable.
For example, you determine that a new lead that comes to your website has a value of $200. You get 16 new leads from last month’s Google Ads campaign, valuing in $3,200 in potential revenue for your company. However, you spent $5,000 on Google Ads within that same time frame. That would mean that this campaign is not performing well and you would need to revisit it to determine why. See also, “Are your Google Ads Ready for a Campaign Restructure?”

Another way you can use Google Analytics is to determine the new vs returning user. While returning users are nice, you do want to see an increase in new users over time.
(see information on users vs visitors here)
• New users: Any profile landing on your website for the first time. Note, that someone visiting your website from their desktop computer and then on their phone, could be counted as two separate users. However, if that same user was logged in to their Chrome account, and access your website from the same account on both devices, they would only be counted as on. Pretty smart Google.
• Returning users: Google tracks users and anyone who has visited your website within the last two years is counted as a returning visitor.
Why is this important? Ensuring that your new user traffic is going up over time is a good metric to keep an eye on. And if you have a website that has a bunch of content where you want to keep users coming back on the regular, you want to also keep an eye on the returning user count. This metric can, of course, vary depending on your marketing goals, but it’s a good one to keep an eye on to determine what kind of traffic is visiting your website, and how familiar people are getting with your company.
First off, for those of you who don’t know what attribution modeling is, it’s a way for you to measure how multiple channels work together to help drive leads/sales for your business. Google Analytics offers a variety of attribution models however, the default measurement is called “Last Click.” This one is pretty self-explanatory and gives 100% of the conversion credit to the last channel an individual converted on. This might make sense for your business, however, it doesn’t for many as it doesn’t tell the complete story.
Let’s take, for example, an individual first comes to your website via a Google Ads campaign but doesn’t convert. Later on they may click through a Facebook remarketing campaign but still not convert. Finally, they decide to come back to the website through a search on Google and come to your website organically. Technically, this individual has come to the website 3 different times before converting and as a result, we want to be able to report on how each channel helped contribute to the final conversion. In this particular case, you may want to consider Linear attribution (even conversion values to each channel) or Time Decay (assigns more value to the sources closest to the conversion).
There are a lot of great comparison tools in Google Analytics for determining the right type of attribution and we highly recommend doing some research in this area to get a better idea of how your marketing campaigns are supporting each other towards your ultimate conversion goals. You can find this feature in Conversions -> Multi-Channel Funnels.
Top conversion paths is a way to build off of your attribution modeling. It helps present a visual as to how your channels are supporting each other. It also allows you to break your channels down into smaller categories like campaigns to take your data a step further. If you don’t know how your customers are coming to you or what type of content they’re engaging with at different stages of your funnel, this is a fantastic starting point.
Below is a visual:
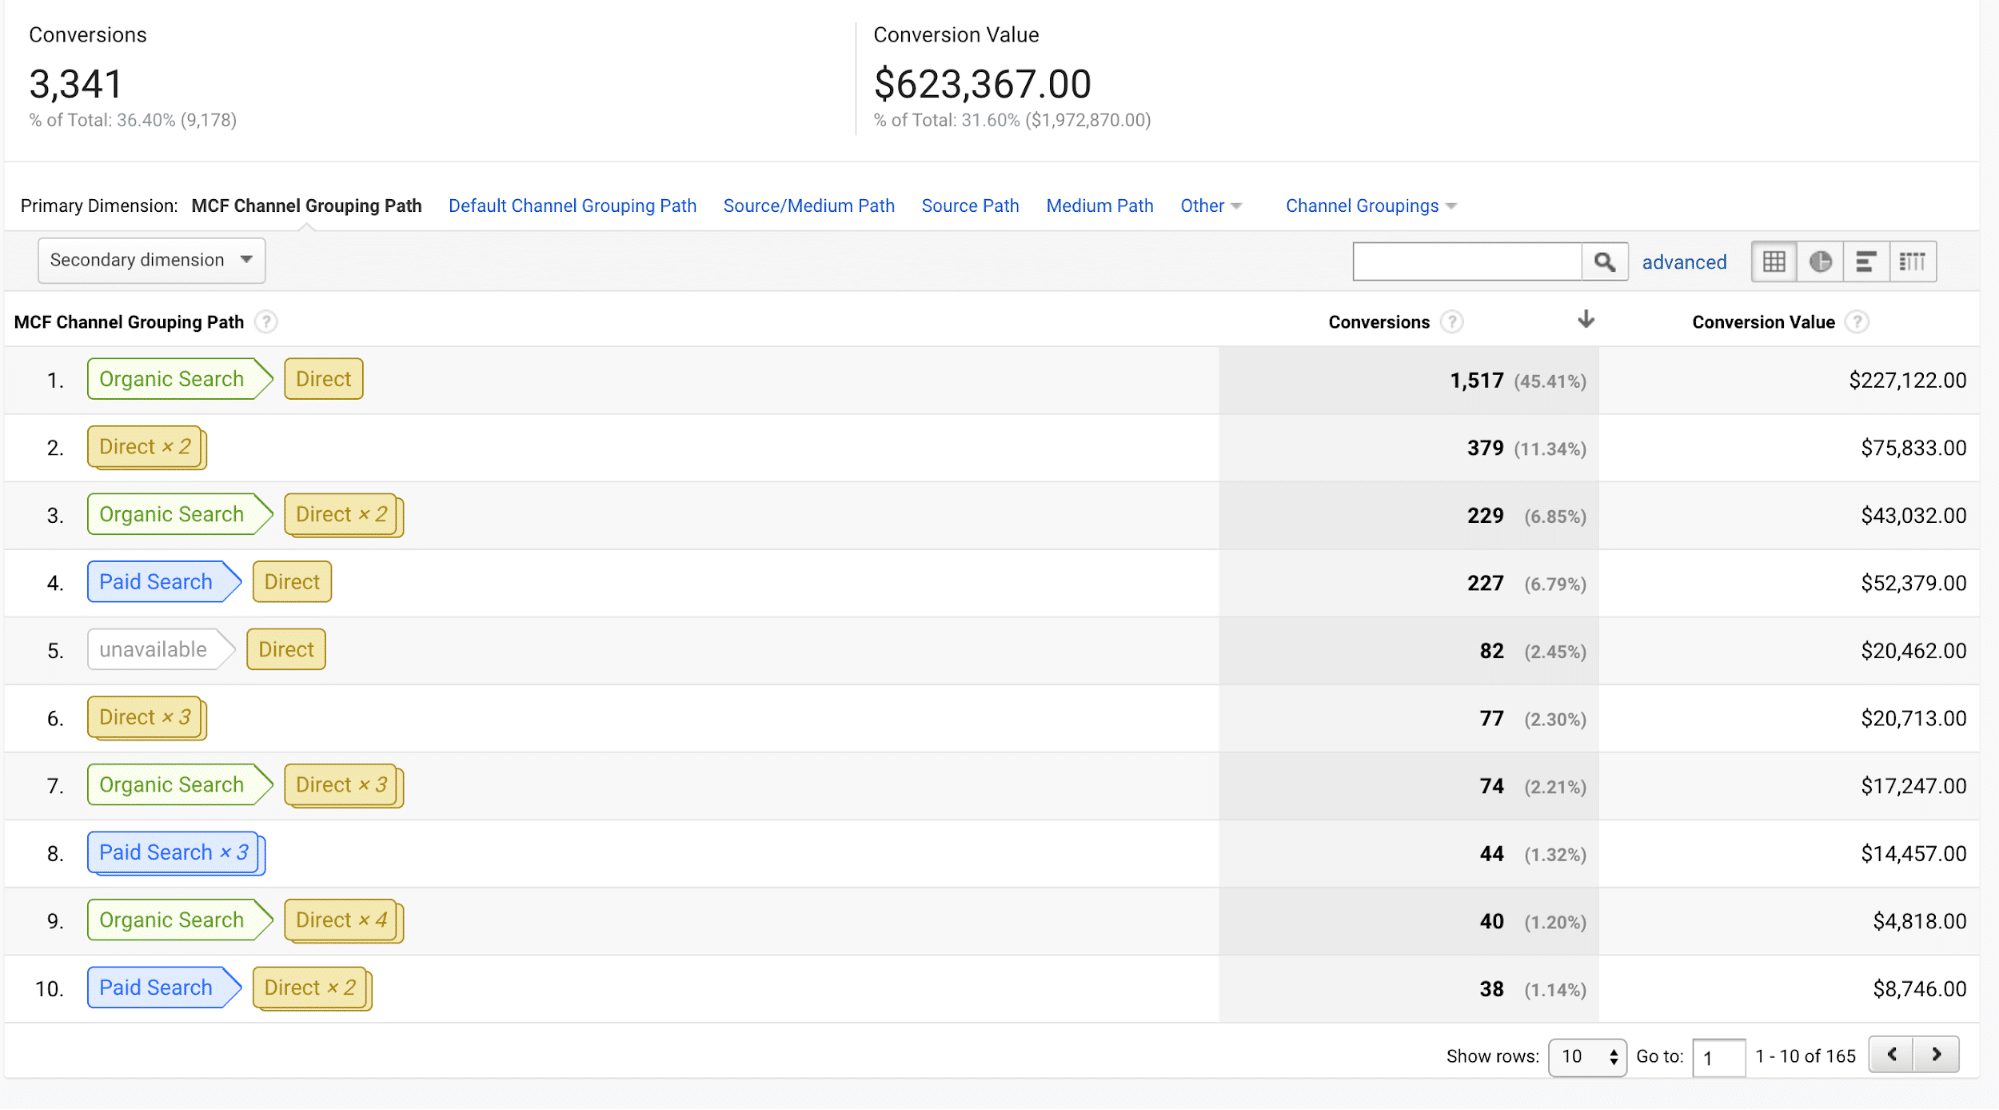 Now, hypothetically, if we were using a last-click attribution model AND we didn’t review this report, we could quickly assume that our organic and paid search channels aren’t working. Take a step deeper into your analytics and review this information to gain those insights you might not have had before. You can review this type of information under Conversions -> Top Conversion Paths.
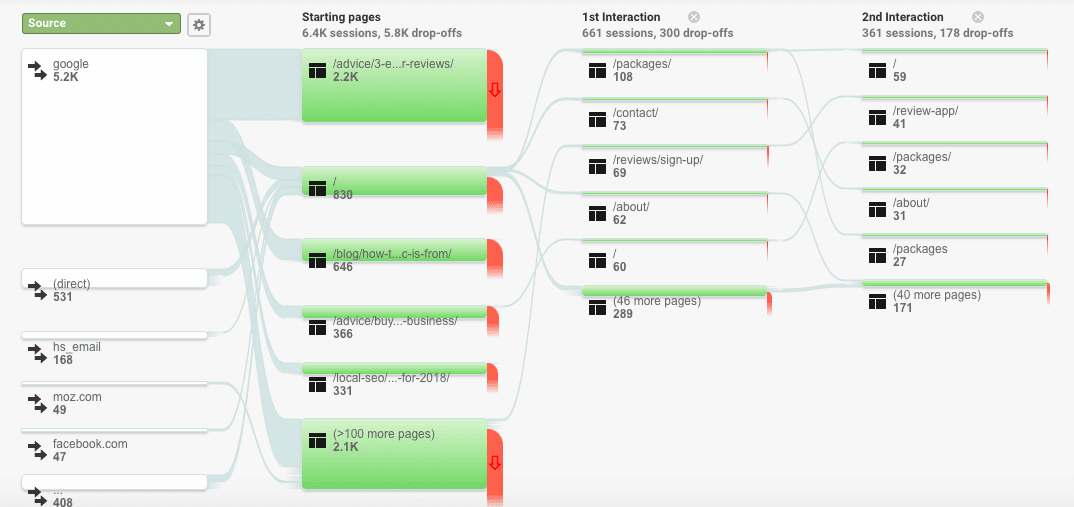
Google Analytics’ Behavior Flow allows you to visualize the path your web visitors take from one page to another or from a page to an event, like filling out a contact form. You can find this report under Behavior -> Behavior Flow.
Here you can see the landing page that most visitors see first, and what pages they go to next if any.
Looking deeper into one of these pages by hovering over the segment, we can see that the drop-off rate is pretty high for one of our most trafficked blog posts.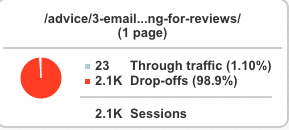
We then selected this page and highlighted its common paths. When people do click off of this page, where do they go if they do stay on the website?
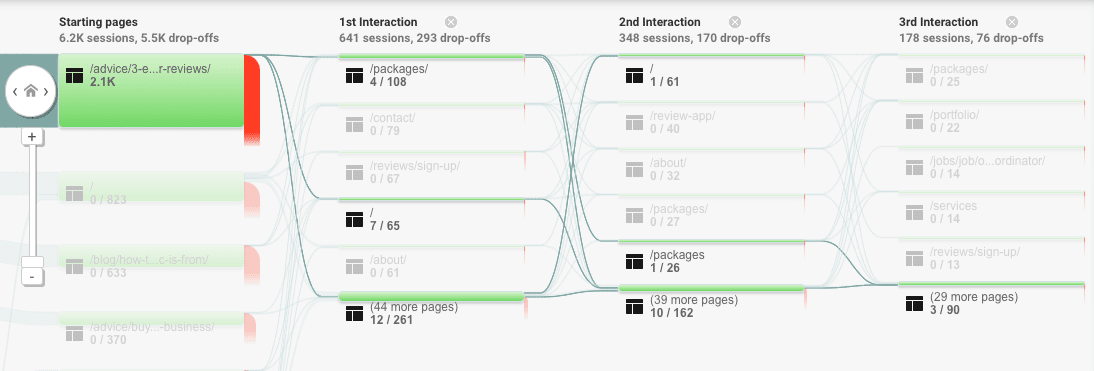
So what should you do with this info?
Improve your rate of success by adding more prominent calls to action. Add links to specific pages on your website you want to drive people to and make it a no-brainer decision for the user to go there next.
Google Analytics is a comprehensive and sometimes overwhelming tool. It’s worth having a basic understanding, however, so you can truly understand how your marketing dollars are doing and where your efforts are making the biggest impact on your bottom line.
Need some help diving deeper into the data? We LOVE data! Give us a shout!
Please use the calendar to the right to book an initial meeting with our sales team.
Have a specific service in mind or looking to share more about your project goals? Close out of this pop-up and fill out the form on the page; one of our sales specialists will get back to you ASAP.